These infographics don't necessarily relate to how machines operate in a factory but I'm looking out for factory production line graphics. Here are some good examples of that:


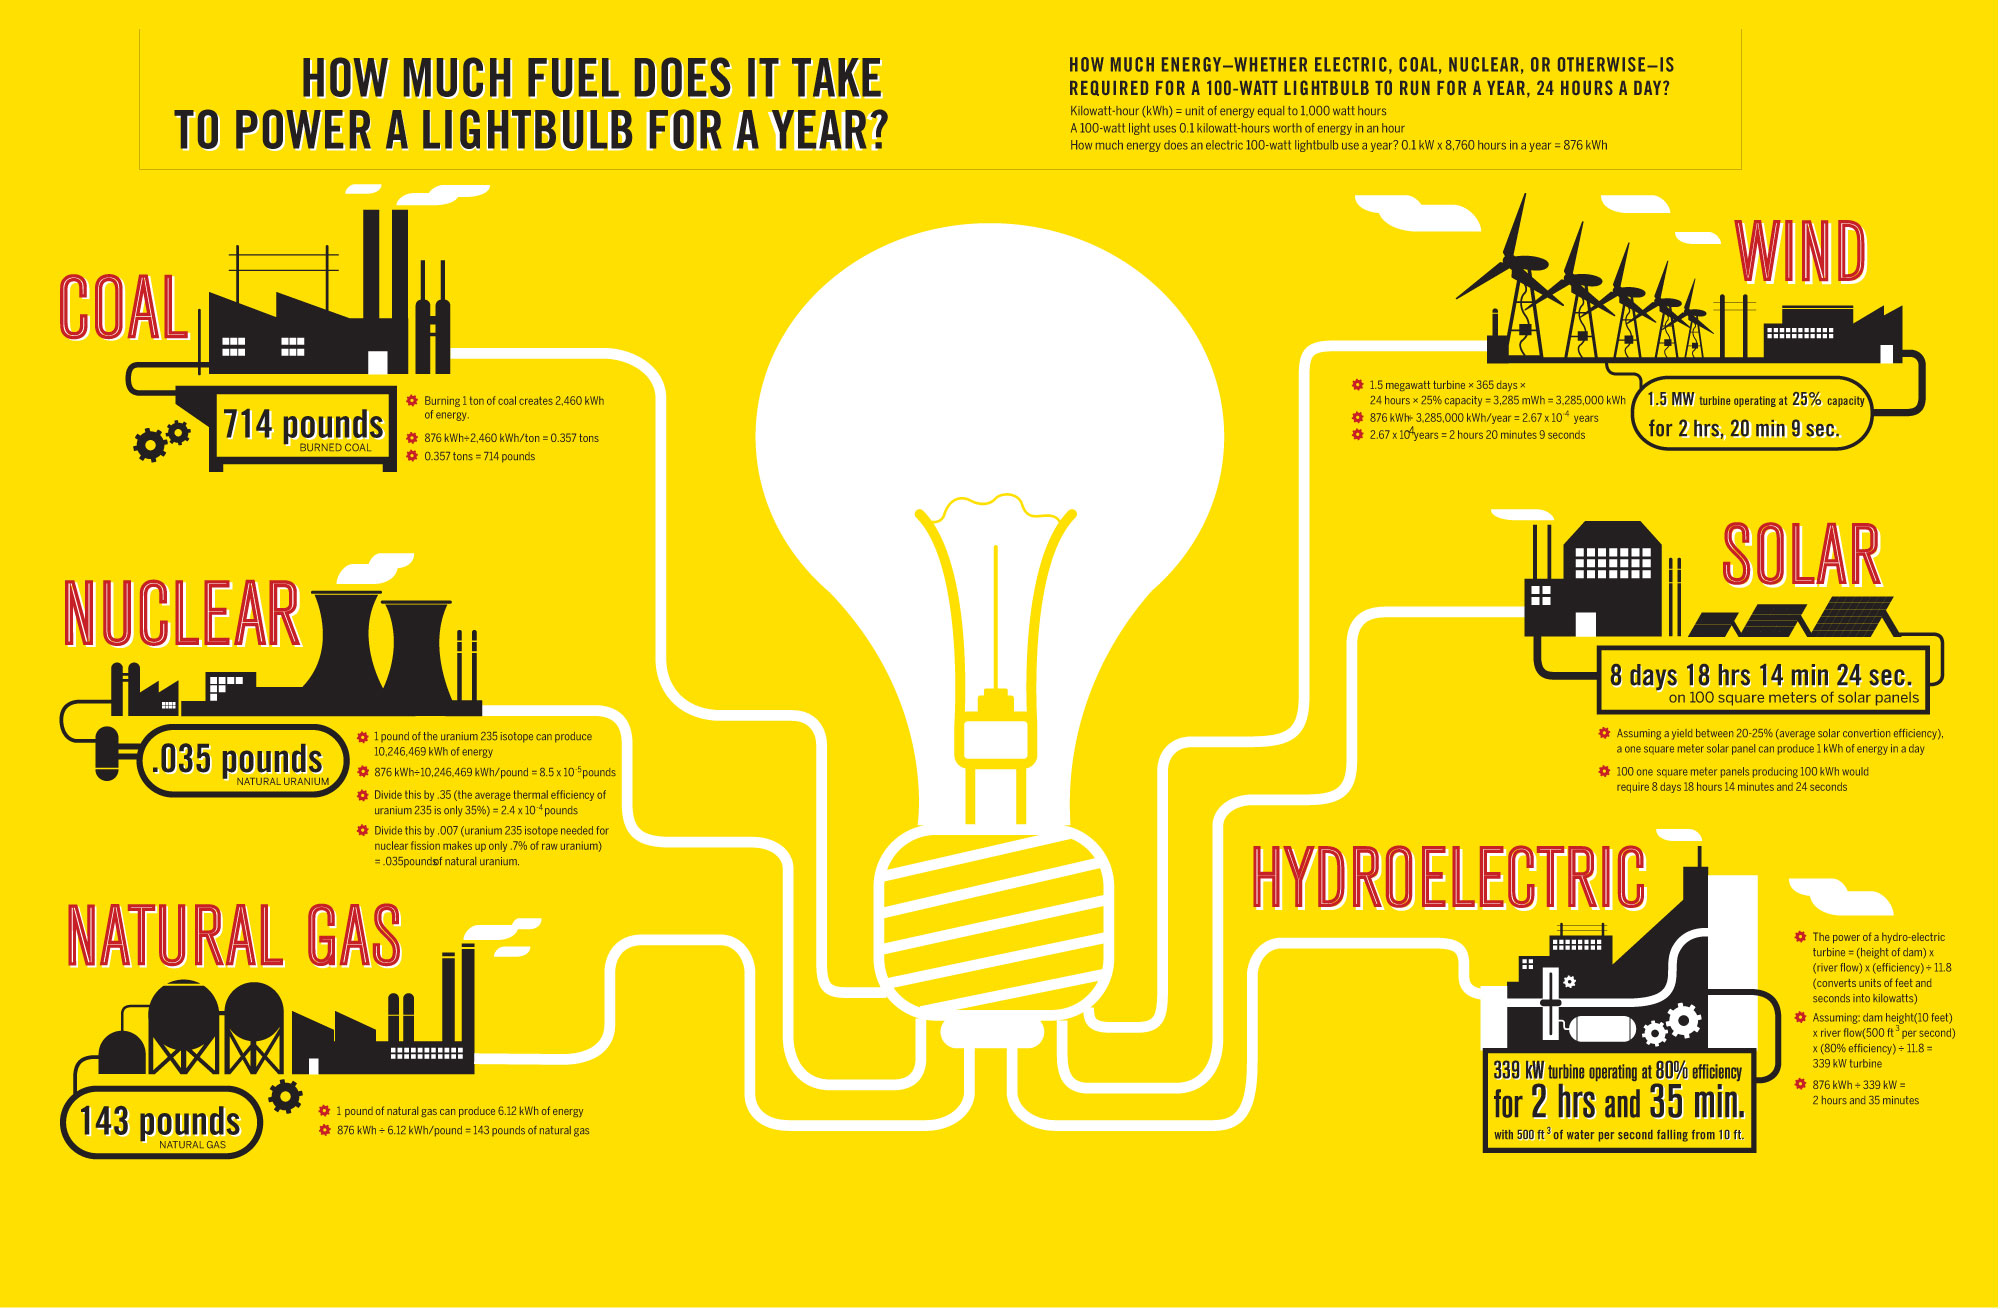
Here are some examples of energy infographics, these could be used to show how much energy each machine was using in production or how much energy is wasted when they are on standby. It could also be used to show the amount of water, air, electricity and Co2 levels used or wasted by machines.

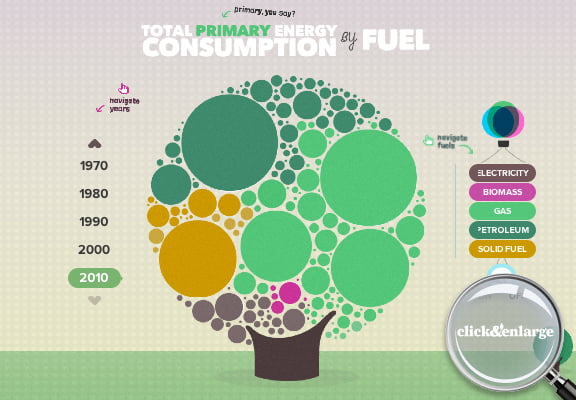
Here are some infographics with good use of colour to show information. When the viewer knows what each colour stands for it is a quick an easy way of getting information.


No comments:
Post a Comment